Trace the source
Explant origin, collection, parent-child trays and lineage support record-level investigation.

RST · Plant Tissue Culture
A connected ecosystem for production control, technician execution, quality, monitoring and AI-assisted decision support.
Implemented core · Documented ecosystem · Deployment-specific verification
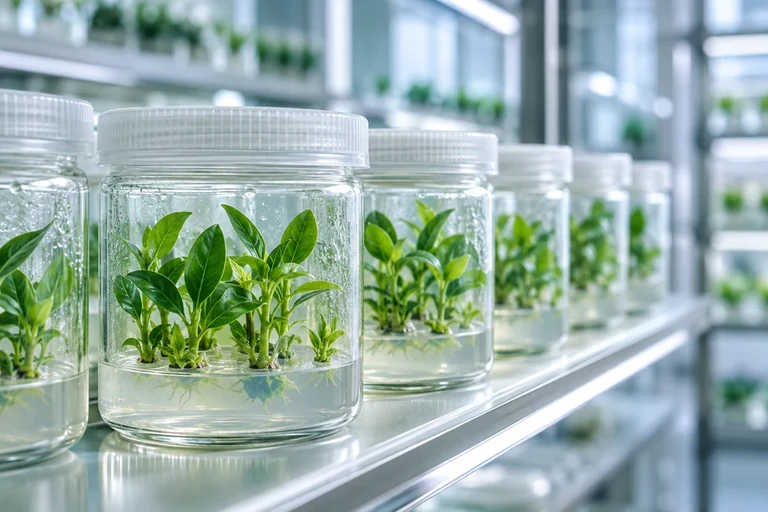
01 / A connected operating picture
Follow the culture record from source and lineage through daily work, quality, readiness and grower support.
RST connects laboratory production, traceability, technician workflows and management visibility. Interfaces are illustrative; AI assistance is presented separately as a proposed enhancement. Deployment scope is agreed for each facility.
02 / Lab Admin Platform
Connect explant and source records, master batches, lineage, production batches, trays and bioreactors. Inspect stages, quantities, locations, materials and exceptions.
Reconstructed admin UI based on documented workflows · No original admin screenshot supplied
Explant origin, collection, parent-child trays and lineage support record-level investigation.
Room/rack/shelf mapping, media, chemicals, overdue work and contamination remain linked to records.
QC status, accepted quantities and commercialisation dates distinguish production from saleable stock.
03 / Technician Tablet Application
The supplied tablet screens show task-focused operations, tray context, location, quality status and history. Swipe the gallery or open a full-size screen.
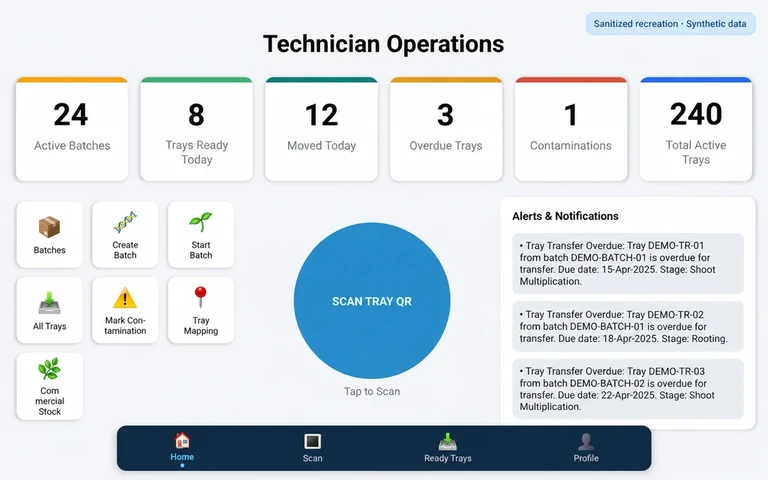
QR scanning, batches, ready trays, contamination and location mapping.
Open full-size screen ↗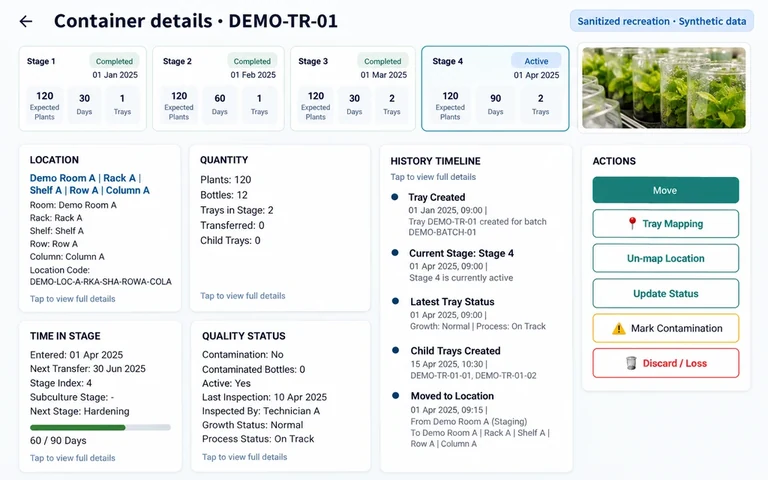
Location, quantity, stage, quality and history beside authorized operations.
Open full-size screen ↗Illustrative interface
04 / Management Mobile Application
Move from active batches and trays to plant-wise, batch-wise and stage-wise detail. Review stock, projected output, forecasts, notifications and room conditions.
Forecasts are planning estimates. Notification retrieval is documented; push delivery depends on configuration, recipient devices and provider credentials.

Production, crop stages and room environment.
Open full-size screen ↗
Grouping, planning windows and batch summaries.
Open full-size screen ↗Illustrative interface
05 / TV & Management Dashboard
A large-screen view for production counts, crop portfolios, room conditions, forecasts, overdue work, contamination and workforce recognition.
ROTATING VIEW · SYNTHETIC SNAPSHOT
Three demo trays need review. Production, accepted quantity and ready stock are different measures.
Reconstructed TV interface · Local demo rotation only · No live production feed
The guides describe Android TV, tvOS and Samsung Tizen views, including remote-controlled forecasts on Tizen. Screen coverage, data binding, refresh behaviour and installed-device compatibility require verification; one reviewed build used fixed headline values.
06 / IoT & Environmental Monitoring
RST EnviroSense Pro · Environmental Monitoring System

The render shows temperature, humidity, lux, Wi-Fi status and normal, warning and critical indicators. The guides document room sensor status and historical readings. Hardware deployment, calibration, thresholds and refresh intervals require confirmation.
Monitoring does not imply automated climate control or actuator integration.
Reconstructed sensor dashboard · Illustrative historical trend, not measured telemetry
07 / Plant Voice AI
A conversational layer for plant and tray context, operational questions and human-reviewed next steps.
Documented: scanned-plant context and conversational responses drawing on available lab records, with missing information identified.
Proposed enhancements: cross-system production answers, proactive recommendations, escalations and broader management assistance. Live backend, latency and installed scope have not been tested here.
No equipment control, autonomous production changes or guaranteed agronomic advice.
Example source: production summary · Synthetic snapshot
08 / Notifications & Persona Layer
Technician reminders, stage due dates, contamination and room alerts bring operational exceptions into app, mobile and dashboard views.
Notification lists and configured alerts are documented. Real-time delivery is deployment-dependent. Management escalations, dashboard reminders and proactive AI recommendations are shown as proposed presentation concepts until demonstrated.
Reconstructed notification experience · Synthetic recipients and records
09 / Two production pathways
The guides document bioreactor counts, subculture stages, next dates, partial transfers and saved operation histories.
Reconstructed workflow · Vessel is an illustrative diagram, not hardware evidence
10 / Quality & Commercial Readiness
Reconcile accepted plants, record QC status, remarks and photos, then apply the relevant commercialisation date and eligibility rules.
Available to sell depends on eligibility, dates and commitments.
Reconstructed QC interface · Documented workflow, synthetic counts
11 / Plant Commerce & Grower Experience
Documented commerce interfaces connect eligible stock with discovery, bookings and commitments. Grower services add plot records, crop observations, support tickets and follow-up.
GROWER WORKSPACE
Reconstructed commerce and grower UI · No original screens supplied
Payment records do not establish payment-gateway capture. Sync timing and reconciliation need demonstration. A sale-to-field or field-to-lab lineage link is not assumed; no automated crop diagnosis, GPS or offline claim is made.
12 / The System View
A logical view of the documented ecosystem—not a verified network or deployment topology.
Roles, authorized actions, histories and reporting
Eligibility, credentials, sync worker and reconciliation require deployment verification.
HTML/CSS architecture visual · Documentation-based relationships, no implied real-time SLA
Built around your operation
Discuss stages, volumes, devices, users, quality decisions and integration requirements with RST.
Ask Raj about the platform. Submit enquiries separately through Project Discovery.
Explore the wider AgriTech ecosystem →